Data & reporting / Illustrative concept
A clearer view of the information.
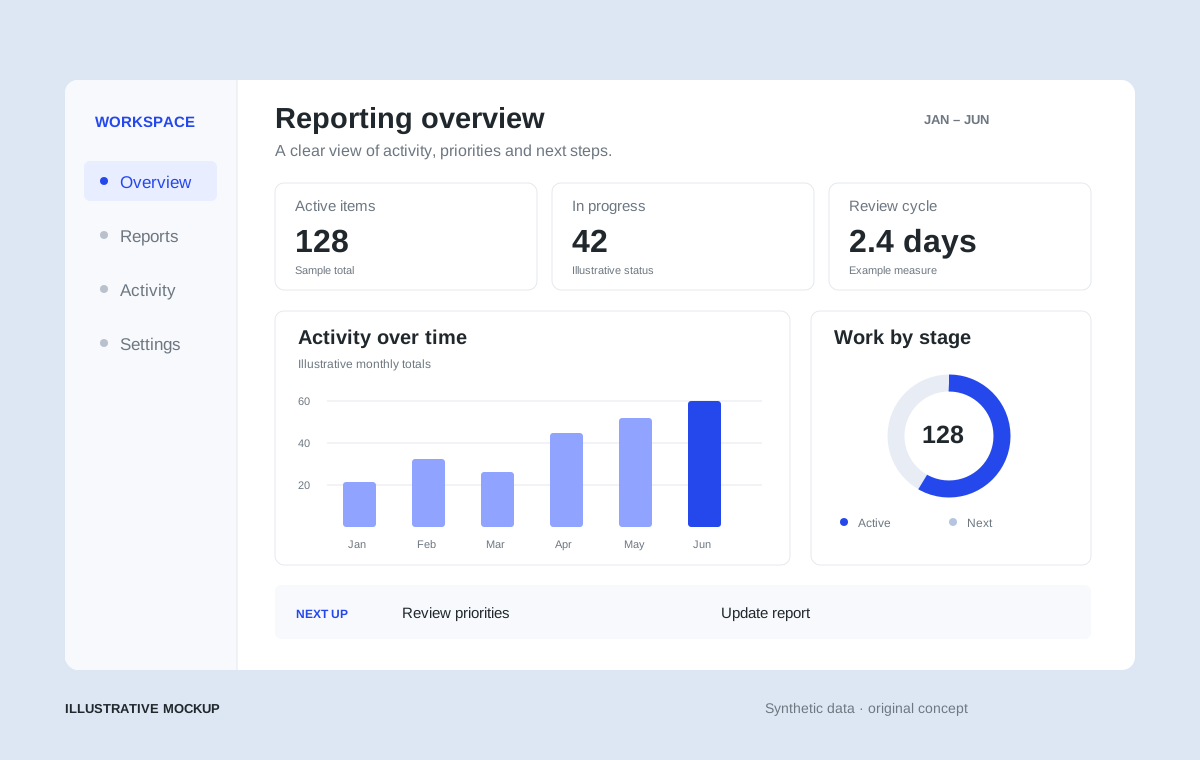
A reporting concept exploring how a few useful measures, clear charts and well organised information can support everyday decisions.
The approach
From question
to something useful.
Start with the questions
Understand who will use the report, what they need to decide and which information helps them take action.
Give the information structure
Group related measures, make definitions clear and choose visual formats suited to the question.
Make it useful in practice
Consider filters, context, accessibility and how people will use the reporting experience as part of their work.
The mockup illustrates an approach and an area of practice.